

Security Operation Centers (SOC) work as the frontline defense where threats are detected, incidents are managed, and the safety of your digital assets is ensured. But how can you be sure your SOC is truly effective? Is it just putting out fires, or is it proactively recognizing and reducing risks before they escalate? Measuring SOC metrics becomes a strategic goal as it improves security and optimizes resources.
This article will explain the importance of security metrics, key indicators to track, and best practices for evaluating SOC performance. We will explain how to assess whether your SOC is operating at peak performance and where there’s room to grow.
Elevate Your Security Operations Center (SOC) Beyond Endpoints
Safeguard your entire digital ecosystem — including networks, cloud infrastructures, and more — with expert-driven, 24/7 monitoring and proactive threat hunting.
Why are SOC Metrics important?
Here are the key reasons why SOC metrics and KPIs are essential:
- Objective performance evaluation. Metrics provide an objective assessment to measure how well the SOC is performing, SOC teams can clearly assess their strong sides and identify areas needing attention.
- Improved resource allocation. For example, if the Mean Time to Detect (MTTD) is high, it may reveal the need for more advanced detection tools or training for the SOC team.
- Improved incident response time. Metrics such as Mean Time to Respond (MTTR) and incident resolution rate help measure how quickly threats are mitigated.
- Demonstrated value to stakeholders. SOC metrics can be used to show how the center is improving overall security, meeting objectives, and reducing risk exposure.
- Continuous improvement. Tracking SOC performance allows security teams to identify trends and fix weaknesses.
11 Key SOC Metrics and How to Measure Them
Let’s examine the commonly used incident response metrics, that can be helpful for measuring SOC performance.

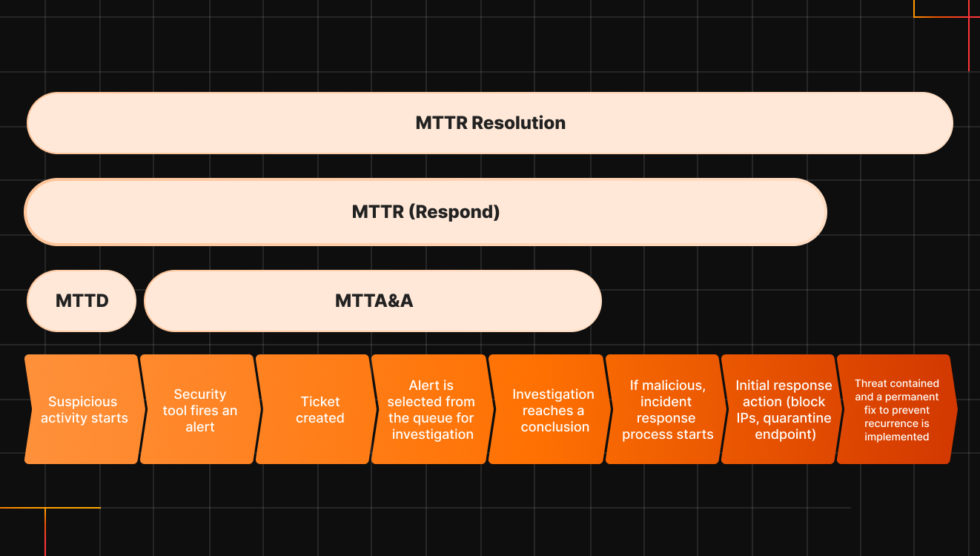
1.Mean Time to Detect (MTTD)
This is a critical security metric that indicates the average duration required for a SOC team to identify an incident or security breach.
A lower MTTD signifies better performance, demonstrating the team’s adeptness at promptly identifying and addressing incidents. Also, MTTD serves as a bar for assessing the efficacy of monitoring tools and the proficiency of detection capabilities.
How is MTTD measured?
Mean Time to Detect (MTTD) is determined by subtracting the “Activity Started At” time from the “Alerted At” time for the earliest event in an incident.
For statistics, MTTD is measured by calculating the average time that it takes for all alert types, so we take a group of alerts for a dedicated time range: (“Alerted At”) – (“Activity Started At”) for each incident and then divide it by (Incidents counter) ~ (50inc *5min + 50inc*15min )/100 ~ MTTD = x. Peridocal comparison highlights potential issues which can help to identify them during retrospectives.
In real life, MTTD depends on tools which are used for SOC:
- SIEM basic detections
- SIEM complex correlation
- EDR
- Firewalls
What’s a good MTTD?
The closer to zero, the better. High-performing SOC teams typically achieve MTTD between 30 minutes and 4 hours. However, latency may increase from early-stage attack events, like compromised VPN authentications, which are harder to detect until more suspicious actions occur on managed devices within the environment.
Experienced and skilled SOC engineers, combined with advanced technical resources, contribute significantly to reducing Mean Time to Detect (MTTD) while improving detection accuracy. Additionally, ML/AI tools enhance MTTD by enabling the detection of complex attacks more efficiently and effectively than traditional static SIEM rules.
2. Mean Time to Acknowledge and Analyze (MTTA&A)
Mean Time to Attend and Analyze (MTTA&A) is one of the most important SOC metrics in assessing the average time SOC teams need to respond to and analyze an incident comprehensively.
Starting from the moment an incident is identified, MTTA&A completes when the team acknowledges and thoroughly evaluates its priority, impact, and possible resolution strategies to outline its extent and repercussions.
How to measure MTTA&A?
MTTA&A tracks the time it takes for a security team to acknowledge an alert and begin analyzing its root cause. To measure it subtract the acknowledgment time from the analysis start time for each alert. Then, average these times over a set period (e.g., 30 days).
What is a good MTTA&A?
While MTTA&A alone does not define SLOs (Service Level Objectives) or SLAs (Service Level Agreements), it is a crucial component of these metrics and directly influences an organization’s ability to meet its commitments. Ensuring a low MTTA&A for high-severity incidents often aligns with the core goals of SLOs and SLAs:
- Critical: within 15 minutes
- High: within 30 mins – 2 hours
- Medium: within 2-6 hours
- Low: within 4-24 hours
3. Mean Time to Respond (MTTR)
This SOC metric complements MTTD by evaluating the efficiency and expediency of a SOC’s incident response efforts. It reflects the efficiency of an organization’s alerting systems and the responsiveness of its incident response team.
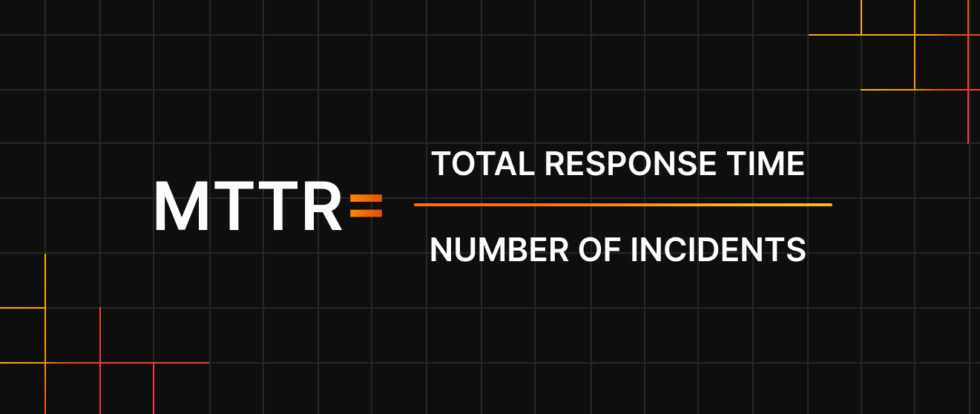
How to measure MTTR:
Start with identifying Response Times. For each incident, document the time between the initial alert and the commencement of response actions. Sum all recorded response times over a specific period and divide by the number of incidents to determine the mean time to respond.

What is a good MTTR:
An optimal MTTR varies depending on the organization’s size, industry, and the complexity of its IT infrastructure. Generally, a shorter MTTR indicates a more efficient response process, minimizing potential damage and downtime.
Severity-based MTTR targets:
Organizations may prioritize response times based on alert severity. Suggested benchmarks include:
- Critical: 1 hour
- High: 2 hours
- Medium: 4 hours
- Low: 8 hours
4. Mean Time to Resolution (MTTR)
Mean Time to Resolution (MTTR) measures the average duration required to fully resolve a system failure or incident, from the initial detection through to the implementation of a permanent fix.
This metric is critically important as the faster an incident is addressed, the lesser the potential damage it can cause.
How is MTTR measured?
Mean Time to Resolution (MTTR) is calculated by averaging the total time taken from activity occurrence to resolution across all alerts over a specified period, typically 30 days.
SOC systems are designed to automatically classify incidents based on factors such as severity, impact, threat type, and other relevant attributes. So incident severity is one of the most important criteria for meaningful calculation of MTTR.
What’s a good MTTR?
Usually, it depends on the severity of the issues. Lower MTTR reduces the risk of significant security incidents.
5. The Number of Security Incidents
The Number of Security Incidents metric represents the count of security incidents identified and reported within a specified time frame, providing organizations with an understanding of prevailing patterns or trends in security incidents.
How to measure the number of Security Incidents?
Establish criteria for what constitutes a security incident in your organization. This typically includes breaches, unauthorized access, malware infections, phishing attacks, etc. Use a SIEM or equivalent logging tool to track all security-related alerts and events. Identify ‘real’ security incidents by correlating alerts and dismissing false positives. Record the number of confirmed security incidents during a given period (e.g., daily, weekly, monthly, or quarterly).
What is a good Number of Security Incidents?
There’s no universal ‘good number’ since it depends on the organization’s size, industry, and risk profile. However, you can use this metric for benchmarking.
For instance, an increase in incident occurrences may demonstrate deficiencies in existing security controls, stimulating organizations to consider enhancements. Monitoring the frequency and trends of security incidents facilitates the identification of prevalent types of cyber threats, allowing the business to prioritize tasks.
6. False Positive Rate (FPR)
False Positive Rate (FPR) measures the proportion of incidents incorrectly categorized as cybersecurity threats when they are not actual risks.
This metric assesses the precision of threat detection systems in discerning between authentic threats and benign activities. An elevated false-positive rate suggests an increased likelihood of generating false alarms, while a lowered False Positive Rate highlights the proficiency of your SOC in identifying real threats.
How to measure False Positive Rate (FPR)?
A false positive occurs when a security system flags a benign activity as malicious. Clearly define what counts as a false positive in your detection system. Use your SIEM, EDR, or other detection tools to log all alerts generated during a defined period (e.g., daily, weekly, or monthly).
Identify True and False Positives: True Positive (TP) is a legitimate threat that has been correctly identified. False Positive (FP) is benign activity mistakenly flagged as a threat. Total Alerts = TP + FP.
The formula for FPR is:


Multiply by 100 to express it as a percentage.
What is a good FPR?
A good FPR typically ranges between 1% and 5%, depending on the type of security tool and environment. Advanced tools with fine-tuned detection may achieve rates as low as
SOAR is one of the most effective tools for reducing the False Positive Rate (FPR). Enabling dynamic workflows tailored to different alert types automates the filtering of false-positive incidents. As a result, organizations can significantly decrease FPR, improving overall efficiency.
7. False Negative Rates (FNR)
False Negative Rates (FNR) represent the proportion of incidents incorrectly classified as non-cyber threats when they are, in fact, real cybersecurity threats.
An increased false-negative rate signifies an increased tendency of the system to overlook actual security threats.
How is the False Negative Rate measured?
Measuring false negatives is tricky — if you could identify all errors, they wouldn’t exist. The assessment involves identifying security events that your systems should have detected but didn’t. Since undetected events are, by nature, difficult to find, organizations often use methods like:
- Quality sampling: Regularly review a sample of events to identify missed detections.
- Retrospective analysis: Compare past alerts with new threat intelligence to spot incidents that were overlooked.
- Red Team exercises: Simulate attacks to evaluate the system’s detection capabilities and uncover gaps.
What’s an acceptable False Negative Rate?
An ideal false negative rate is 1% or lower.
8. The Cost of an Incident
The cost of an Incident metric enables organizations to quantify both the direct and indirect expenses associated with an incident.
Direct costs encompass expenditures like time and resources allocated for detection and response, along with legal fees. Indirect costs involve revenue loss stemming from customer turnover, regulatory fines, reputational harm, and other related factors.
How to measure the Cost of an Incident?
Measuring the cost of a security incident involves evaluating both direct and indirect expenses associated with detection, response, recovery, and business impact.
Direct Costs=Internal Response Costs+External Services+Regulatory Fines
Indirect Costs=Revenue Loss+Customer Attrition+Brand Impact Costs
Total Cost of Incident=Direct Costs+Indirect Costs
What is a good Cost of an Incident?
Ideally, the goal is to minimize the total cost of incidents by preventing breaches.
A mature organization aims to contain incidents within a few thousand dollars, especially for low-severity issues.
9. Incident Escalation Rate
Incident Escalation Rate assesses the proportion of incidents necessitating escalated resolution involving higher-level team members or external specialists, usually via escalated calls.
An increased escalation rate may signify either a deficit in expertise within the SOC team or the requirement for additional resources to effectively handle incidents.
How to measure an Incident Escalation Rate?
Determine what qualifies as an escalation (e.g., incidents that require advanced analysis, cross-functional involvement, or external escalation). Log each incident that gets escalated during a defined period (e.g., weekly, monthly).
Use the formula:


Example:
If 20 incidents out of 100 total incidents are escalated in a month.


What is a good IER?
5–20%: A typical range for a well-functioning SOC.
Lower escalation rates (closer to 5%) indicate that Tier 1 analysts are effective at resolving incidents without further involvement.
10. Incident Closure Rate
Incident Closure Rate represents the proportion of resolved security incidents compared to the total reported incidents within a specified time frame.
A good Incident Closure Rate signifies the proficiency of a SOC in not only detecting and responding to threats but also in conclusively resolving them.
How to measure Incident Closure Rate?
An incident is considered “closed” when all investigation, remediation, and documentation are complete, and no further action is required. You need to log the total number of incidents handled during the period. Count the number of incidents marked as “closed” in the same period.
Then, use the formula:


Example:
If a SOC resolved 85 incidents out of 100 in a month


What is good ICR?
80–95%: This is considered a healthy range for most security teams.
Above 90%: Indicates high efficiency in resolving incidents, assuming no shortcuts are taken in the investigation or remediation process.
11. Incident Containment Rate
The Incident Containment Rate serves as a key performance indicator (KPI) that measures the SOC’s proficiency in containing incidents post-identification.
A good Incident Containment Rate is critical in reducing the potential extent and consequences of cyber threats.
How to measure Incident Containment Rate?
The Incident Containment Rate (ICR) is calculated using the following formula:


What is a good ICR?
Above 90%: This is typically considered excellent. It shows that a high percentage of incidents are being effectively contained within the expected time frame, limiting damage and disruption.
70%-90%: This is generally good but indicates room for improvement in speed or effectiveness of incident containment.
Below 70%: This may indicate poor incident response times or inadequate containment procedures. Immediate improvements should be made to minimize the risk of serious damage.
5 SOC Measurement and Evaluation Best Practices
To ensure that SOC metrics and KPIs are useful and actionable, it’s important to follow these best practices:
- Establish clear and relevant metrics. Align your SOC metrics with your organization’s specific security goals. Metrics should be measurable, and relevant, and provide insights into critical aspects of security operations.
- Regular monitoring and reporting is a key. Regularly monitor and report on SOC performance. Create a schedule for reporting metrics (weekly, monthly, quarterly) and ensure that results are analyzed and acted upon.
- Leverage automation. Use automated tools to track and report SOC metrics. SOC automation helps ensure accuracy, reduces the risk of human error, and saves time, allowing SOC analysts to focus on more strategic tasks.
- Focus on continuous improvement. Regularly review SOC processes, SOC tools, and performance to identify areas for improvement. The threat landscape is always evolving, and so too should your SOC’s ability to adapt and enhance its capabilities.
- Incorporate benchmarking. Compare your SOC performance against industry standards or best-in-class benchmarks. This will help you set realistic goals and identify areas where your SOC may be falling short.
Improve your Security Operations Center (SOC) performance
Our expert team is available 24/7, ensuring rapid detection and response to threats. Reduce Mean Time to Respond (MTTR) to just 15 minutes and alert noise by over 82%, minimizing potential damage and maintaining business continuity.
SOC as a Service with UnderDefense:
At UnderDefense, we understand the complexities involved in managing a high-performance SOC. That’s why we offer comprehensive Managed SOC services designed to optimize the performance of your security operations.
Our SOC as a service integrates cutting-edge technologies, AI-driven threat detection, real-time monitoring, and a team of expert analysts dedicated to protecting your organization around the clock. We work closely with your team to ensure that all relevant SOC metrics are not only tracked but optimized for maximum efficiency and effectiveness.
With UnderDefense Managed SOC, you gain:
- 24/7 monitoring and real-time incident response.
- Proactive threat hunting and advanced forensics capabilities.
- Comprehensive performance analytics and continuous improvement strategies.
- Tailored SOC solutions that align with your organization’s unique needs.
UnderDefense’s AI-driven SOC automation solutions can streamline your security operations, reduce response times, and improve overall efficiency in threat management.
The Bottom Line
Security operations center metrics are essential for measuring the effectiveness of your SOC, improving threat detection and response times, and ensuring that your organization’s cybersecurity is operating effectively. By tracking the right metrics, continuously reviewing performance, and leveraging best practices, your SOC will be better equipped to handle evolving threats.
1. What are SOC metrics, and why do you need to track them?
SOC metrics are key performance indicators (KPIs) used to measure the effectiveness of a Security Operations Center. They help teams track security events, response efficiency, and overall threat management. Without proper metrics, it’s difficult to assess whether a SOC is functioning optimally or if improvements are needed.
2. How often should SOC metrics be reviewed?
SOC metrics should be monitored continuously, but formal reviews typically happen weekly or monthly. Regular analysis ensures that security teams can quickly adjust their strategies based on new threats and trends.
3. What tools are commonly used to measure SOC metrics?
Many organizations use SIEM (Security Information and Event Management) systems, SOAR (Security Orchestration, Automation, and Response) platforms, and custom dashboards to track SOC performance. These tools help automate data collection and provide real-time insights.
4. What’s the difference between operational and strategic SOC metrics?
Operational metrics focus on real-time efficiency, like response times and alert volumes.
Strategic metrics help leadership make long-term decisions, such as ROI on security investments or compliance adherence rates.
5. Can SOC metrics help with compliance?
Absolutely. Many regulations, such as SOC 2, ISO 27001, and GDPR, require businesses to demonstrate effective security monitoring. Strong SOC metrics provide the data needed for compliance reporting and audits.


