")
")
Bitcoin’s price has been consolidating in a tight range, giving no indication about whether it’s going to recover or experience a deeper correction. Figuring out whether there is an accumulation or a distribution happening would be key to determining the future direction of the market.
Technical Analysis
By Edris Derakhshi (TradingRage)
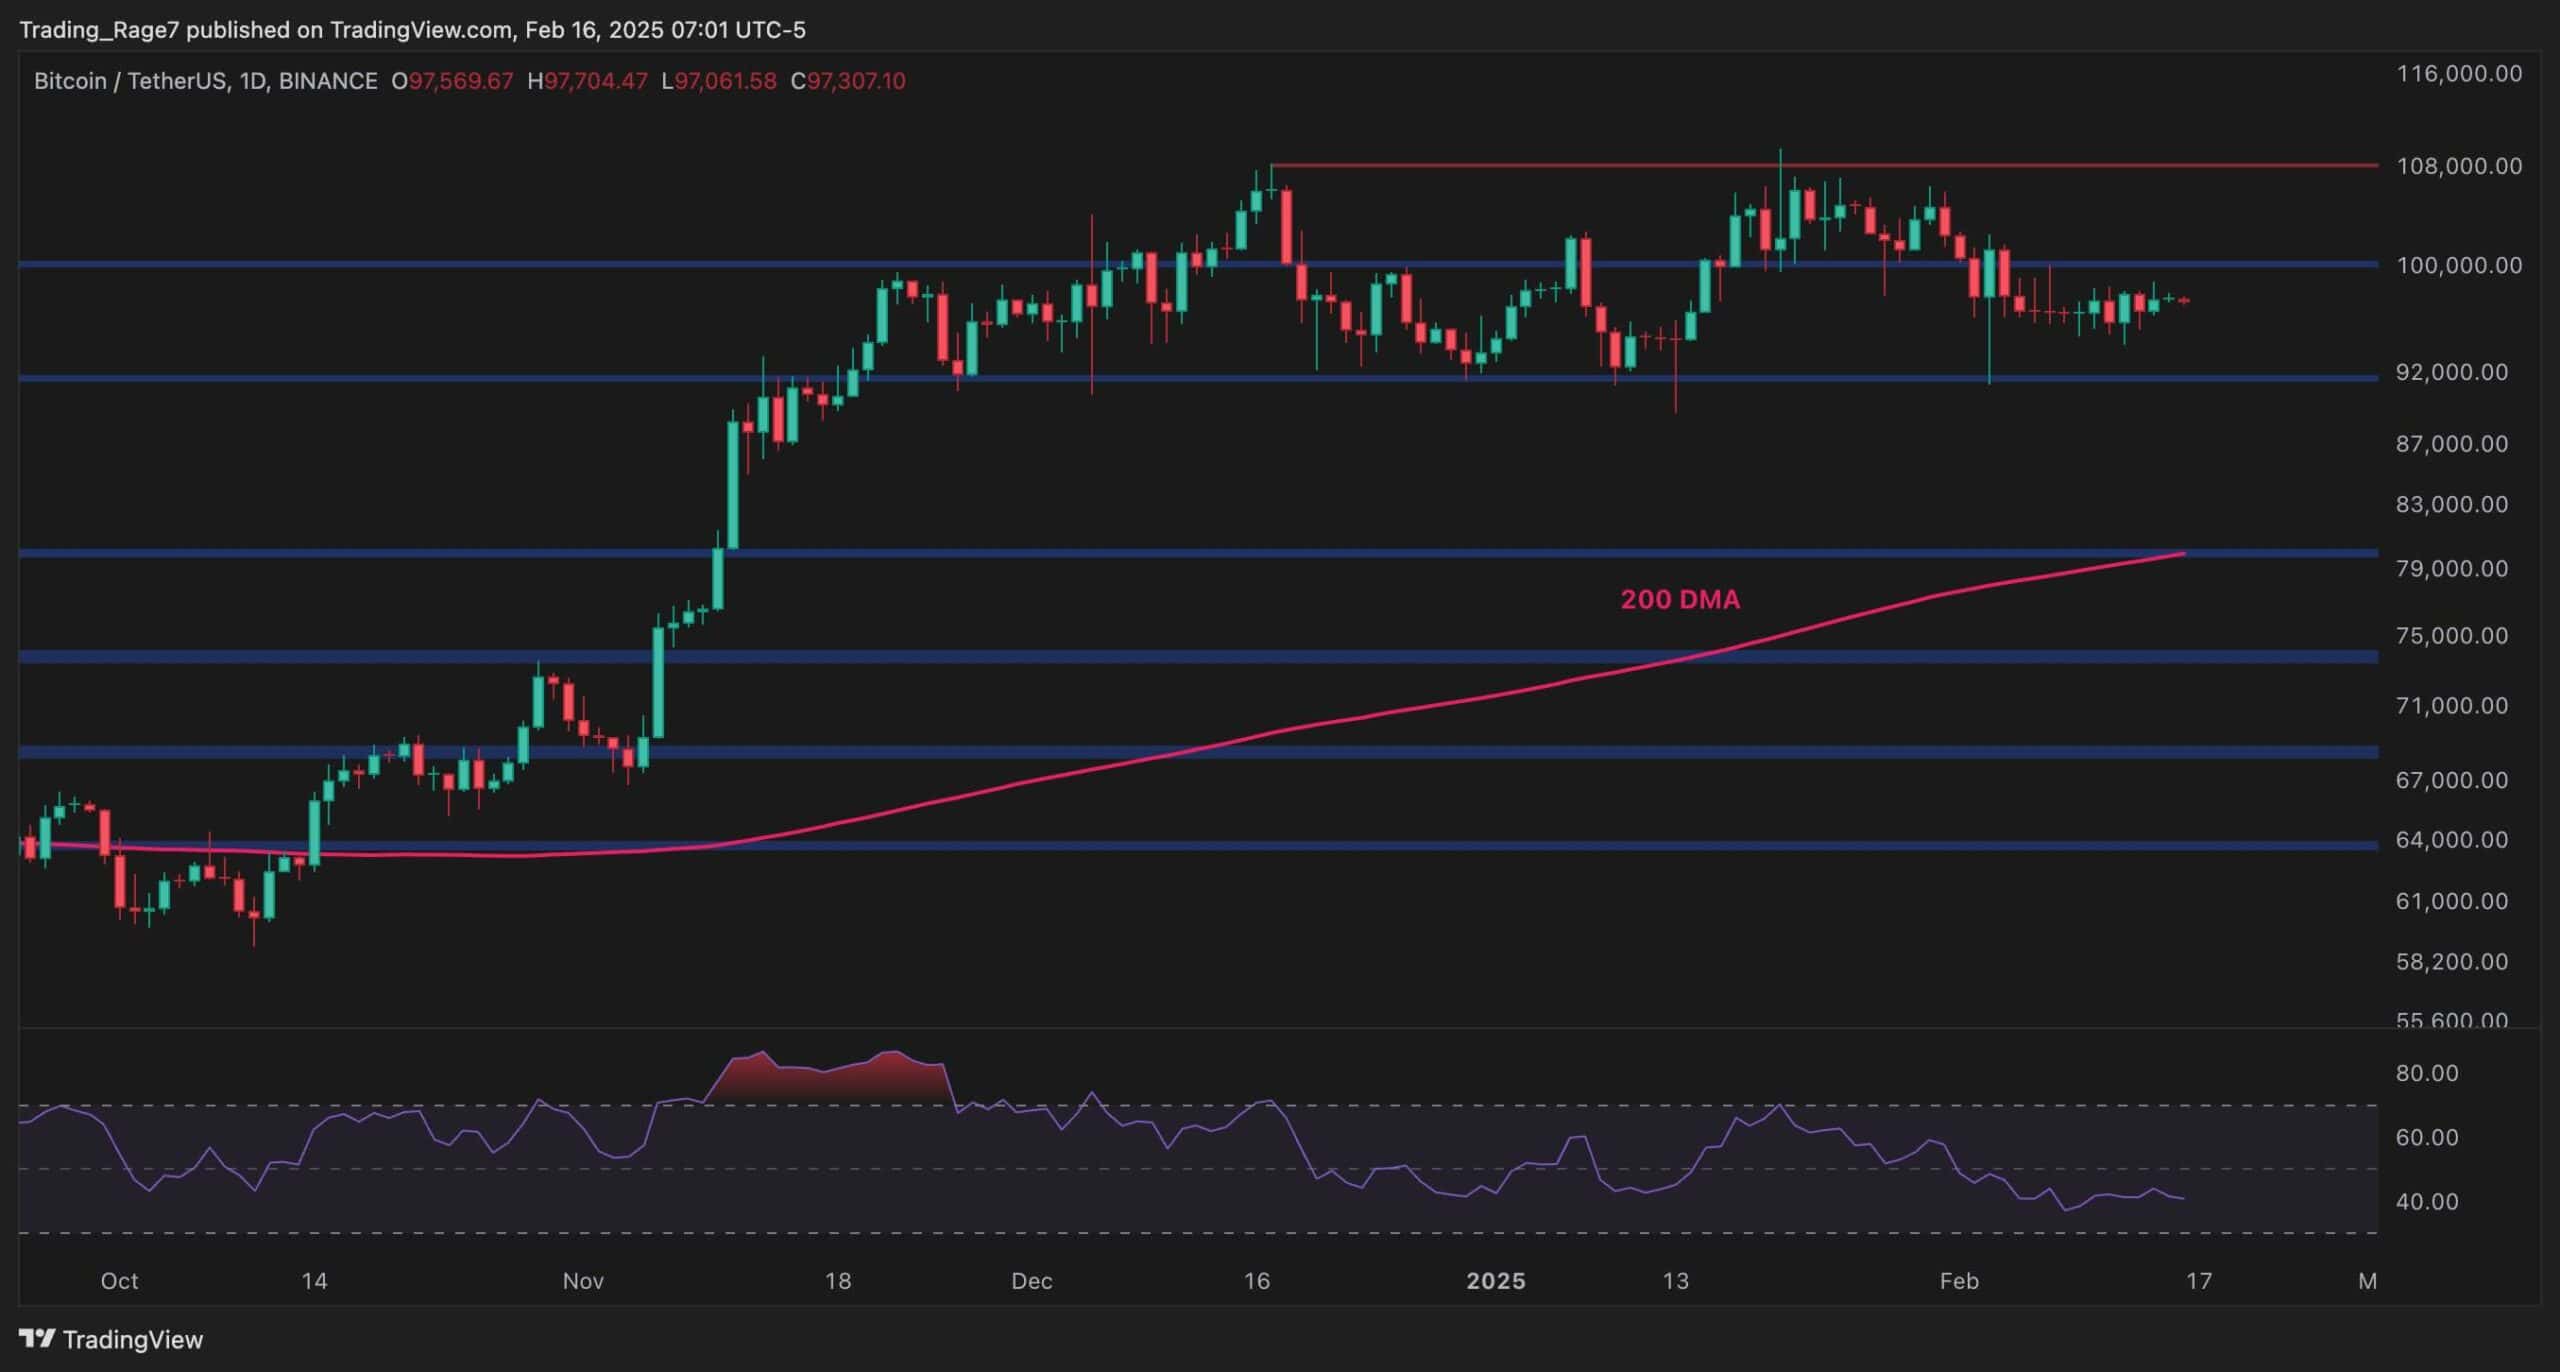
The Daily Chart
On the daily chart, the price has been moving sideways since breaking below the $100K level, while also being supported by the $92K level.
While the RSI has been showing values below 50%, which indicates the momentum is bearish, the market still remains above the 200-day moving average, which is currently located at around the $80K mark. Yet, there is still the possibility of a deeper drop toward the $80K zone before a bullish continuation could be expected.
The 4-Hour Chart
Looking at the 4-hour chart, it is evident that the price has been creating a symmetrical triangle pattern, which is yet to be broken to either side.
Currently, the market is likely to test the lower boundary of the pattern once again, as it has recently been rejected from the higher one, and the RSI has also dropped below 50%, which further strengthens the probability of a bearish move in the short-term. If the triangle is broken down, a decline toward the $92K area would be imminent.

On-Chain Analysis
By Edris Derakhshi (TradingRage)
Exchange Reserve
The BTC price action has been quite choppy and has failed to begin a definitive move in either direction. Therefore, analyzing the accumulation and distribution behavior of market participants could be very helpful.
This chart presents the BTC exchange reserve metric, which measures the amount of Bitcoin held in exchange wallets. It is usually seen as a proxy for supply, as these coins can be sold quickly and add to the selling pressure.
As the chart suggests, the exchange reserve has dropped rapidly over the past few weeks. However, in recent days, there has been a slight increase, which might indicate market participants’ uncertainty and lack of conviction about a price rally in the short-term. As a result, if this increase continues, the price will likely drop lower in the upcoming days.

Binance Free $600 (CryptoPotato Exclusive): Use this link to register a new account and receive $600 exclusive welcome offer on Binance (full details).
LIMITED OFFER for CryptoPotato readers at Bybit: Use this link to register and open a $500 FREE position on any coin!
Disclaimer: Information found on CryptoPotato is those of writers quoted. It does not represent the opinions of CryptoPotato on whether to buy, sell, or hold any investments. You are advised to conduct your own research before making any investment decisions. Use provided information at your own risk. See Disclaimer for more information.
Cryptocurrency charts by TradingView.


? This AI token might be the following catch")
? This AI token might be the following catch")


